The Best Golf Stats to Track to Lower Your Handicap
Tracking the right golf stats to track transforms a frustrating round into a clear roadmap for improvement. Rather than obsessing over your final score, measuring specific metrics like greens in regulation, scrambling, and penalty strokes reveals exactly where you lose strokes. This guide breaks down the most actionable statistics for amateurs, explains how to log them without expensive hardware, and shows how to use the data to build a targeted practice plan.
Why Tracking Golf Stats Matters More Than Your Final Score
Your final score only shows the result of your round, while detailed statistics reveal the specific causes of your mistakes. Tracking metrics like fairways hit and scrambling percentages establishes a performance baseline, allowing you to identify whether your weaknesses lie in driving, approach play, or the short game.
As Eric Peyton Golf notes, the final score is “merely the tip of the iceberg”. To genuinely understand your strengths and chart a path toward lower scores, you must delve deeper. Under Par Performance Golf highlights that once you track five to ten rounds, you establish a baseline average for metrics like putts per round and scrambling. This baseline eliminates guesswork, ensuring you practice more efficiently by focusing on the exact areas that cost you the most strokes.
How to Track Greens in Regulation and What It Reveals

AI illustration · Golf Daily RoundUp
Greens in regulation measures the percentage of holes where you reach the green in two strokes less than par. This statistic is the strongest single predictor of scoring potential for amateur golfers, directly correlating with your handicap and highlighting the true effectiveness of your iron play.
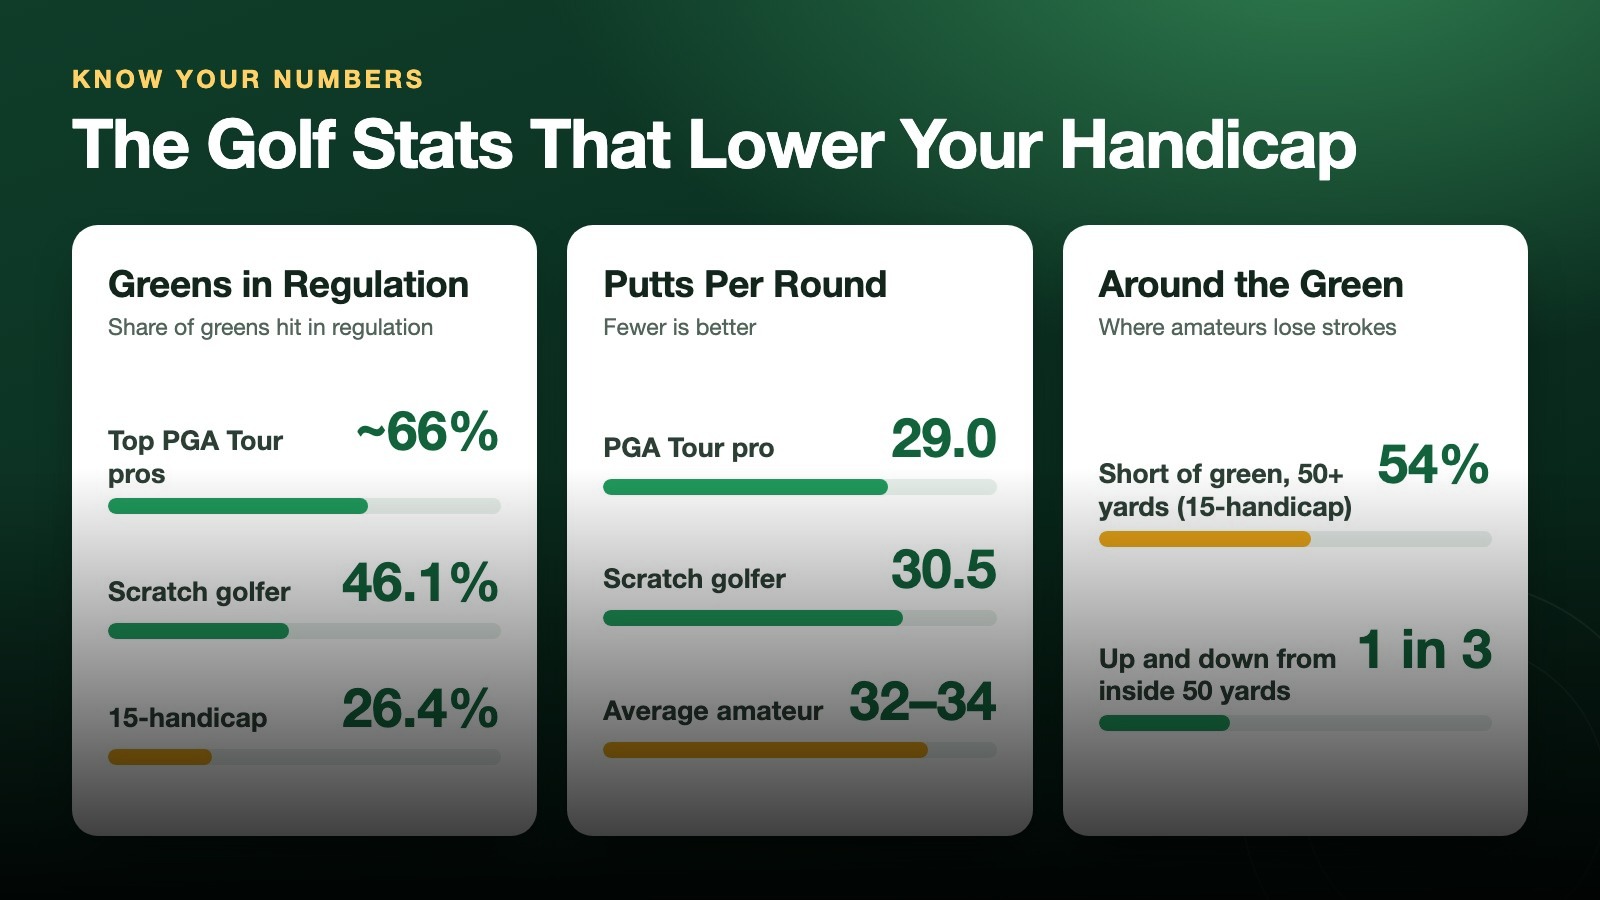
A GIR means hitting the green in two shots on a par-4 or three on a par-5. According to Break X Golf data analyzing over 3,700 rounds, a scratch golfer averages 56.8% GIR. Even top PGA Tour pros only average around 66%, according to Golf Monthly. If you want to know what handicap you are heading toward, this number provides the answer.
It is not just about hitting the green; it is about avoiding the most common amateur miss. Shot Scope data reveals that the average 15-handicap comes up short of the green 54% of the time on approach shots beyond 50 yards. Tracking GIR alongside your miss direction helps you identify if you are consistently underclubbing or struggling with distance control.
What Your Fairways Hit and Penalty Stroke Counts Tell You
Fairways hit measures your driving accuracy, while penalty strokes track the costly mistakes that inflate your scorecard. Monitoring these two statistics together reveals whether your tee shots are setting up manageable approach shots or forcing you into high-risk recovery situations that lead to double bogeys.
Hitting the fairway is crucial for setting up subsequent shots. Eric Peyton Golf suggests marking a fairway hit on your scorecard and drawing an arrow for the direction of any miss. If you notice a high percentage of missed fairways to one side, it might be time to focus on your driver accuracy or consider a more conservative club off the tee.
Penalty strokes are the ultimate scorecard killer. A single out-of-bounds or water hazard adds a stroke and forces a replay, turning a potential par into a likely bogey. As one Golf Top 100 Teacher advised a playing partner, the simplest way to improve is to “just avoid doubles”. For beginners, Lynx Golf recommends tracking just four things initially: total score, putts, penalties, and a simple fairway or rough result.
How to Interpret Putts Per Round and Scrambling Percentages

AI illustration · Golf Daily RoundUp
Putts per round measures your total putting strokes, while scrambling tracks how often you save par after missing the green in regulation. Evaluating both metrics together provides context, preventing you from misinterpreting a low putt count that simply results from chipping the ball close to the hole.
Scratch players average closer to 30 putts per round, and PGA Tour pros hover around 29. However, this number is highly misunderstood. If you miss greens but chip to two feet, your putting average looks great while your short game did the actual work. Conversely, hitting every green but leaving putts 40 feet away yields a mediocre putting average despite solid iron play.
This is where scrambling becomes vital. Shot Scope notes that from inside 50 yards, the average golfer has roughly a 1 in 3 chance of getting up and down. Tracking your up-and-down percentage by club helps you identify which wedge or chipping technique yields the most success, allowing you to lean into your strengths around the greens.
Can You Calculate Strokes Gained Without Expensive Sensors?

AI illustration · Golf Daily RoundUp
True strokes gained analysis requires precise shot-location data typically gathered by GPS sensors, but amateurs can approximate these insights by tracking their score relative to par on specific hole types. Analyzing your average score on par-3s, par-4s, and par-5s provides a highly actionable, hardware-free alternative to expensive tracking systems.
Mark Broadie’s strokes-gained research at Columbia University transformed how professionals evaluate performance, but you do not need a sensor system costing $200–$400 to borrow the idea. Golfity calls your score by par type the single most revealing stat you can get from a scorecard alone.
Take two golfers who both shoot 90 on a par-72 course with four par-3s, ten par-4s and four par-5s. The first averages +1.5 on par-3s, +1.0 on par-4s and +0.5 on par-5s. The second averages +0.5 on par-3s, +0.8 on par-4s and +2.0 on par-5s. Both are 18 over par, but the first loses the most per hole on par-3s and needs iron work, while the second leaks strokes on par-5s, which points to course management and long-game decisions. This breakdown shows where your strokes go without a phone in your pocket.
Try it with your last round below, or with the totals from several rounds for a truer picture.
Scoring by par type calculator
Enter your strokes over par on each type of hole, or fill in a scorecard, to see whether your par-3s, par-4s or par-5s cost you the most.
Strokes over par: add up your score minus par on every hole of that type. A par-3 played in 4 is +1; a birdie is −1.
Set each hole’s par from your scorecard. Holes left empty are skipped, so a 9-hole round works too.
How to Use Your Data to Build a Better Practice Plan
You use your tracked statistics to allocate your practice time proportionally to the areas where you lose the most strokes, rather than practicing what you already do well. By comparing your personal baselines against established handicap benchmarks, you can design targeted drills that directly address your specific weaknesses.
If your data shows you miss greens short 54% of the time, spending an hour at the range hitting 7-irons at your target without checking your club selection is counterproductive. Instead, practice with your 6-iron to build confidence in taking an extra club. If your scrambling is below 30%, dedicate your short game practice to chipping to specific zones rather than just trying to hole everything.
The true value of data lies in connecting the full game to the short game. For instance, if your fairways hit percentage is low but your scrambling is high, your driving accuracy might not be the urgent priority. Conversely, if you hit 60% of fairways but your GIR is still low, your approach play from the short grass needs immediate attention. Data removes the emotion from your practice schedule, ensuring every bucket of balls serves a strategic purpose.
Practical Takeaway Checklist
- Before your next round, decide on three core metrics to track: Greens in Regulation, Putts Per Round, and Penalty Strokes.
- Use a simple scorecard or a basic app to log these numbers immediately after each hole.
- After the round, compare your GIR percentage to the handicap benchmarks to identify your primary area for improvement.
- Dedicate at least 50% of your next practice session specifically to the weakness identified by your data.
Frequently Asked Questions
What golf stats should a beginner track?
Beginners should start by tracking just four fundamental metrics: total score, total putts, penalty strokes, and a simple fairway or rough result for tee shots. This minimal approach prevents overwhelm while providing enough data to identify obvious patterns in your driving accuracy and overall course management.
How many putts per round is considered average?
The average amateur golfer takes between 32 and 34 putts per round, while scratch golfers average around 30.5 and PGA Tour professionals average 29.0. Keep in mind that this number should always be evaluated alongside your greens in regulation percentage to provide proper context for your performance.
What is a good greens in regulation percentage for my handicap?
A good GIR percentage scales directly with your handicap: scratch golfers average 62% GIR, 10-handicappers average 35% GIR, and 15-handicappers average 23% GIR. If your GIR falls below these benchmarks, your approach play and iron distance control require focused practice to lower your scores and break through your current plateau.
Related articles
Reviewed by Shahid Anwer · Editorial standards